Key Takeaways
- Kick viewership has soared 200% since last year
- Twitch is experiencing a post-pandemic stabilization phase where viewership, despite fluctuations, managed to sustain a robust audience presence, underscoring the platform’s resilience in the face of market variations
- YouTube Gaming has experienced a significant resurgence in hours streamed, unique channels, and average concurrent viewership.
- Facebook Gaming faces challenges with maintaining consistent viewer growth in a competitive streaming market.
Q3 2024 Hours Streamed
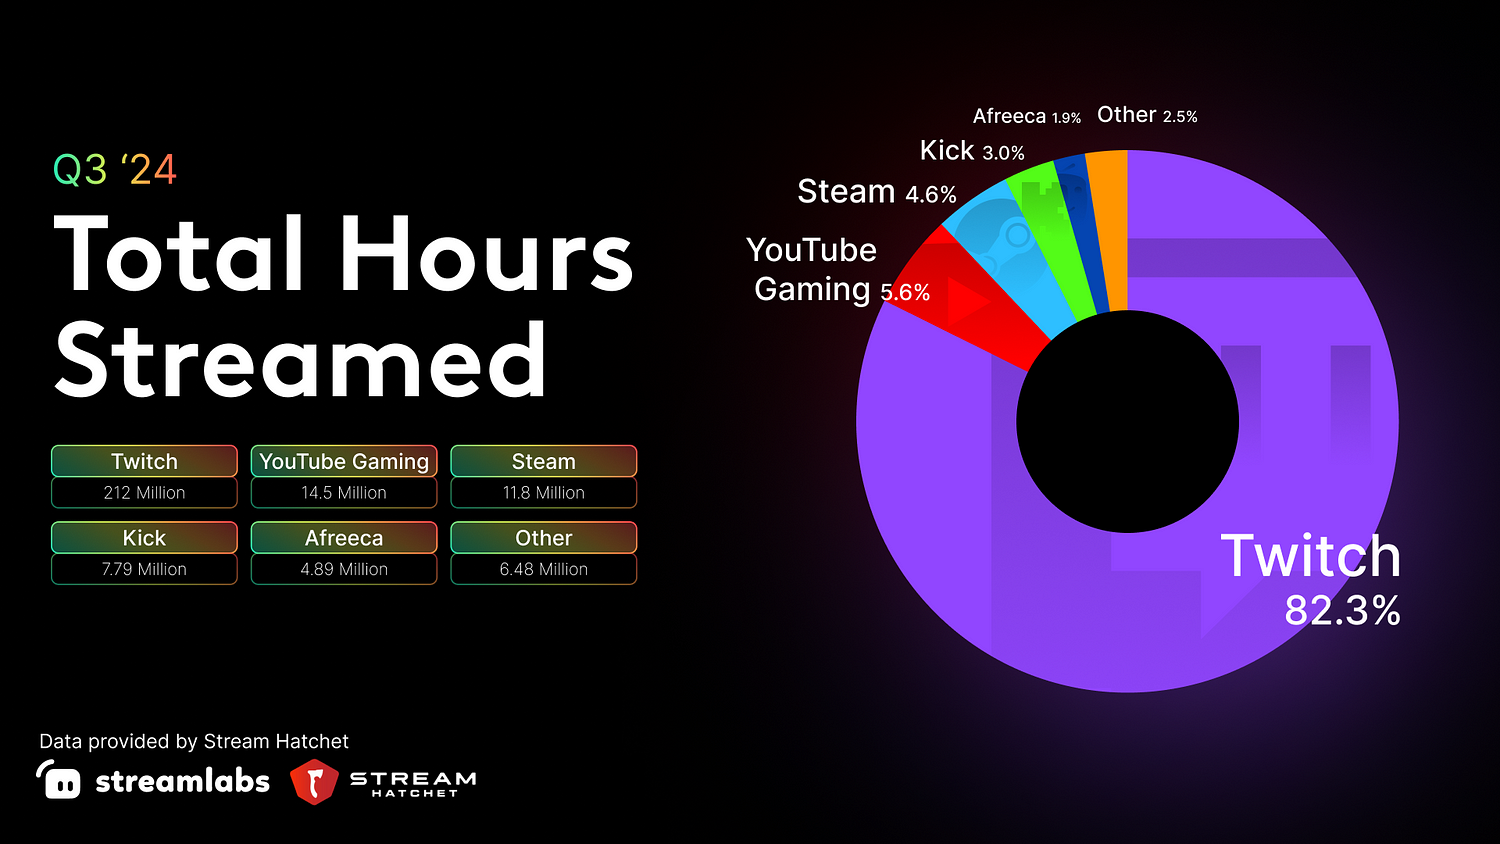
The data for Total Hours Streamed in Q3 2024 across various platforms shows a clear difference in content creation activity. Twitch leads the way with a massive 211,849,644 hours streamed, confirming its continued dominance in the live streaming world.
In comparison, YouTube Gaming comes in second with 14,464,876 hours, marking it as an important but distant runner-up in live gaming streaming.
Steam sits in the middle with 11,809,040 hours, pointing to its potential growth in live streaming in this competitive field.
Platforms like Kick have relatively low engagement, with 7,785,859 hours streamed. However, the rate of growth exhibited in such a short time is nothing short of remarkable.
Q3 2024 Hours Watched
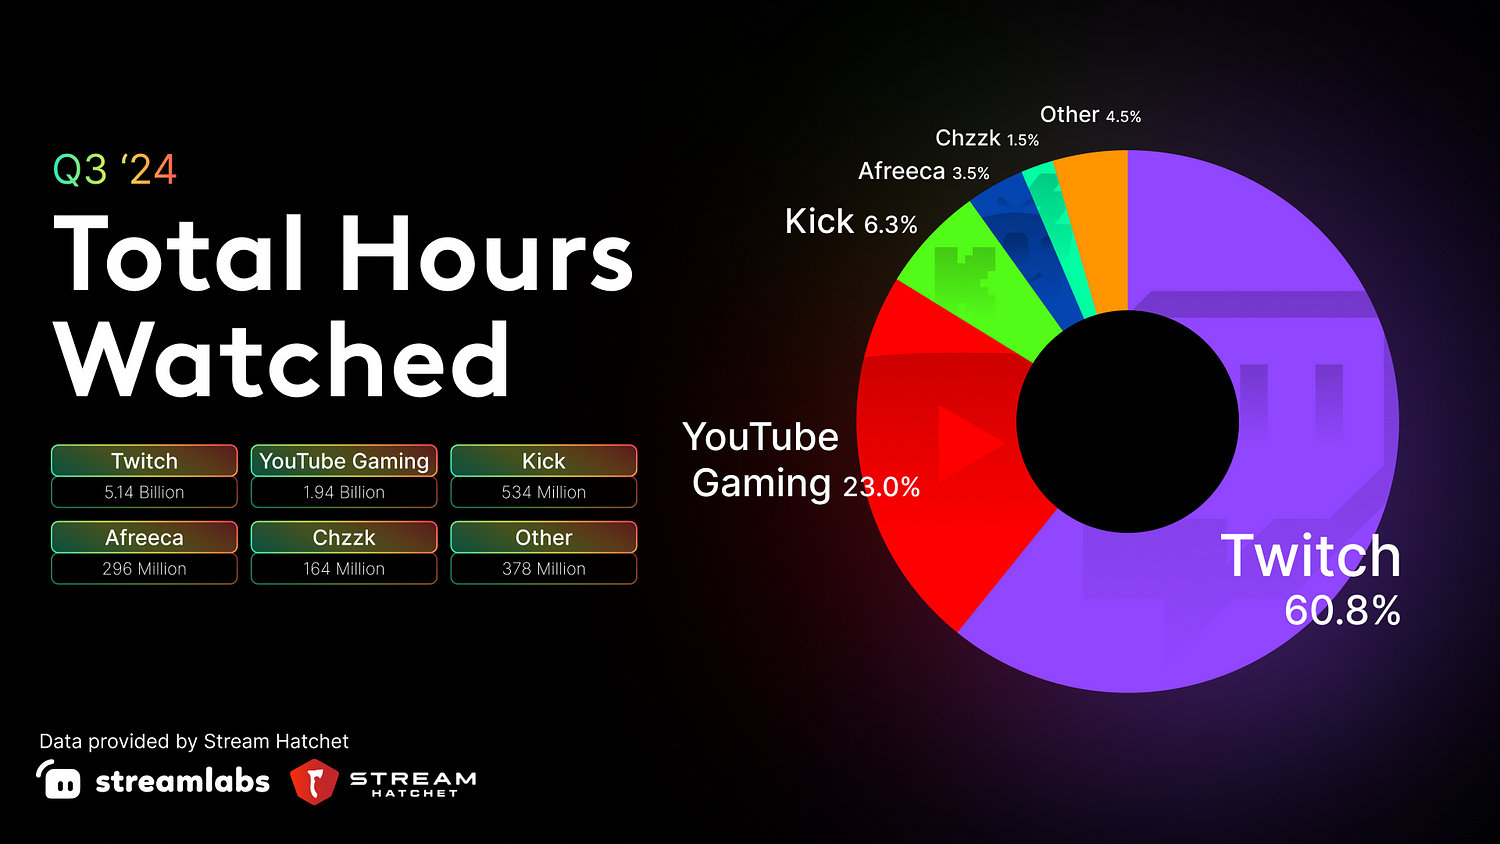
Looking at the Q3 2024 Hours Watched data, it’s clear that Twitch remains the leader with an impressive 5,142,762,709 hours watched, way ahead of other platforms. This top spot shows Twitch’s strong user engagement and tight-knit community in the live streaming world.
YouTube Gaming comes in second with 1,942,749,479 hours watched, proving it’s a strong competitor even if it’s quite a bit behind Twitch.
Kick is making waves with 533,907,913 hours watched, showing it’s catching people’s attention and has potential to grow its audience.
Afreeca, with 295,797,685 hours watched, still holds a solid place, likely thanks to its unique content and regional focus. Chzzk, a part of Naver, finishes the top five with 163,639,744 hours watched, showcasing its niche appeal and room for growth in specific markets.
Q3 2024 Unique Channels
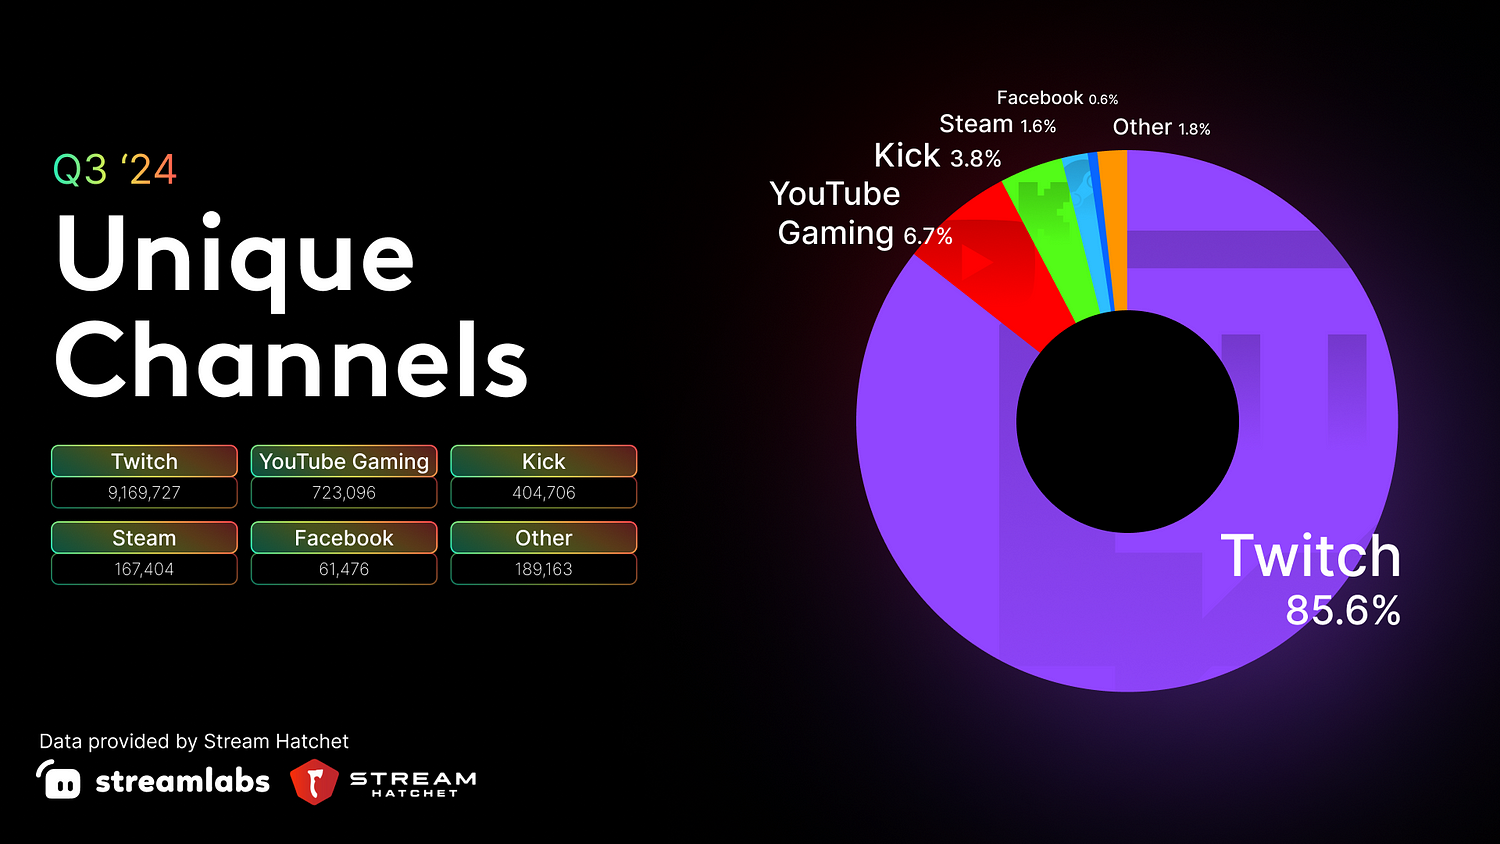
Twitch leads the pack with an impressive 9,169,727 unique channels, cementing its status as the top choice for content creators and reinforcing its role as a go-to hub for broadcasters.
YouTube Gaming comes in next with 723,096 unique channels. While it’s a smaller number compared to Twitch, it still marks a strong presence, showing its ability to attract a wide array of creators.
Kick is the third major player with 404,706 unique channels, hinting at growing popularity among streamers.
Afreeca, with 57,929 unique channels, finds its niche by focusing on specific regional interests and fostering a tight-knit community.
Lastly, Chzzk, a branch of Naver, has 64,731 unique channels, showcasing its appeal in a specialized market that benefits from Naver’s wider ecosystem.
Kick
Kick experienced explosive growth as a new live streaming platform entering the space. The consistent quarter-over-quarter increase suggests a successful strategy in expanding the platform’s audience and retaining viewer interest.
However, with success comes challenges. As the platform grows, Kick will face increasing competition from other established live streaming platforms. To maintain its momentum and stay ahead of the competition, Kick must continue innovating its features and offering streamers unique opportunities to connect with their audience.
Moreover, Kick must adapt its content moderation policies accordingly as it expands. This is crucial in maintaining a positive community atmosphere and avoiding potential controversies that could harm the platform’s reputation.
Overall, Kick appears to be successfully paving the way for sustained growth in the live streaming market.
Hours Watched
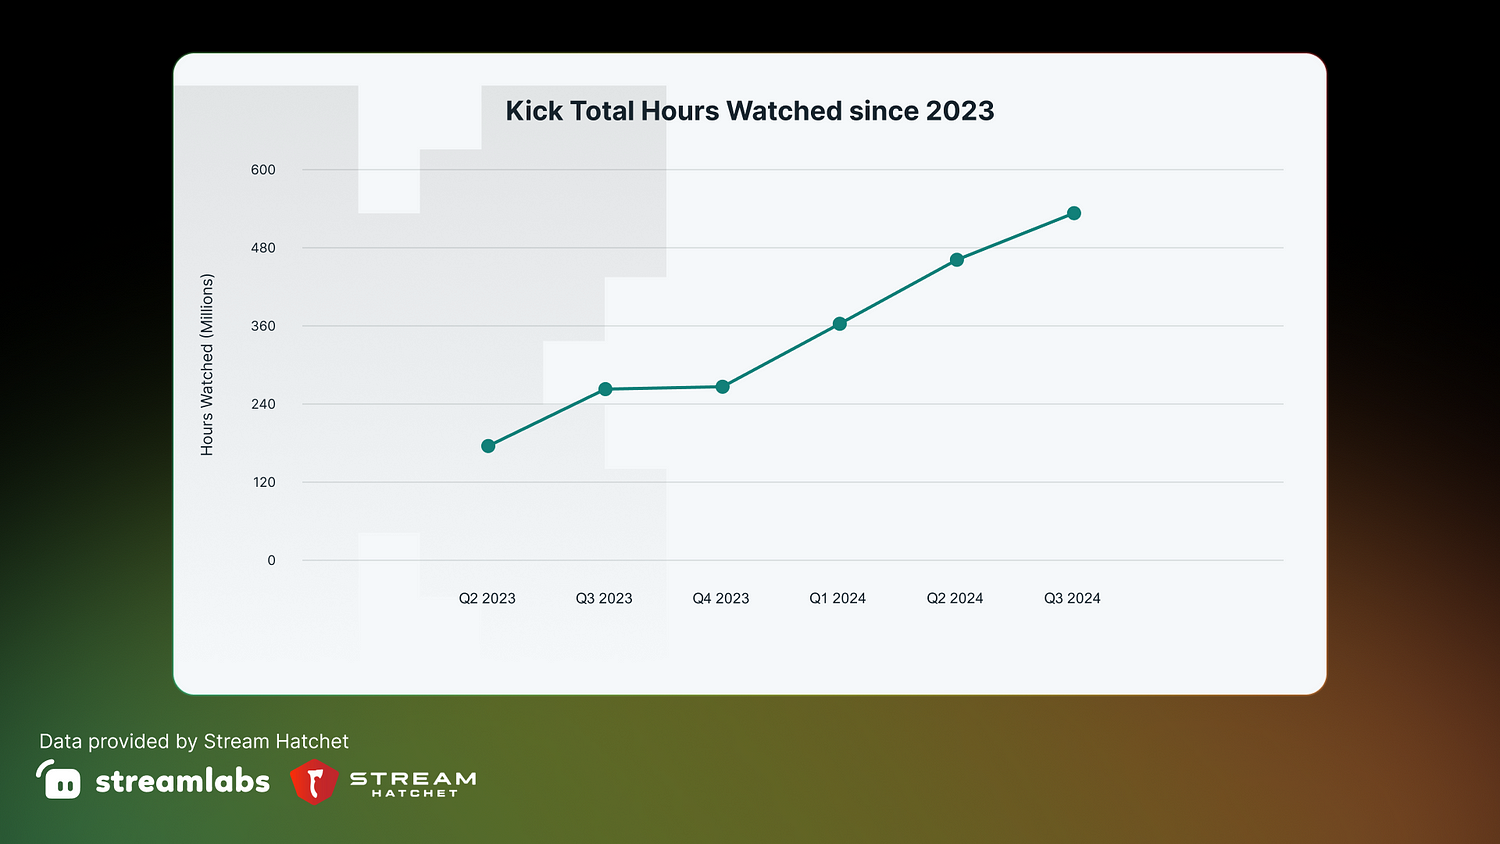
Kick experienced rapid and explosive growth upon entering the market. The figures show a substantial increase from 175,832,441 hours watched in Q2 2023 to 533,907,913 hours by Q3 2024, representing an overall growth of approximately 204% over the period.
To put this growth into context, Mixer, the now-defunct streaming platform backed by Microsoft, amassed just over 100 million hours watched in Q2 2020 before shutting down. Kick has achieved approximately five times that number, with over 500 million hours watched on the platform last quarter.
Hours Streamed
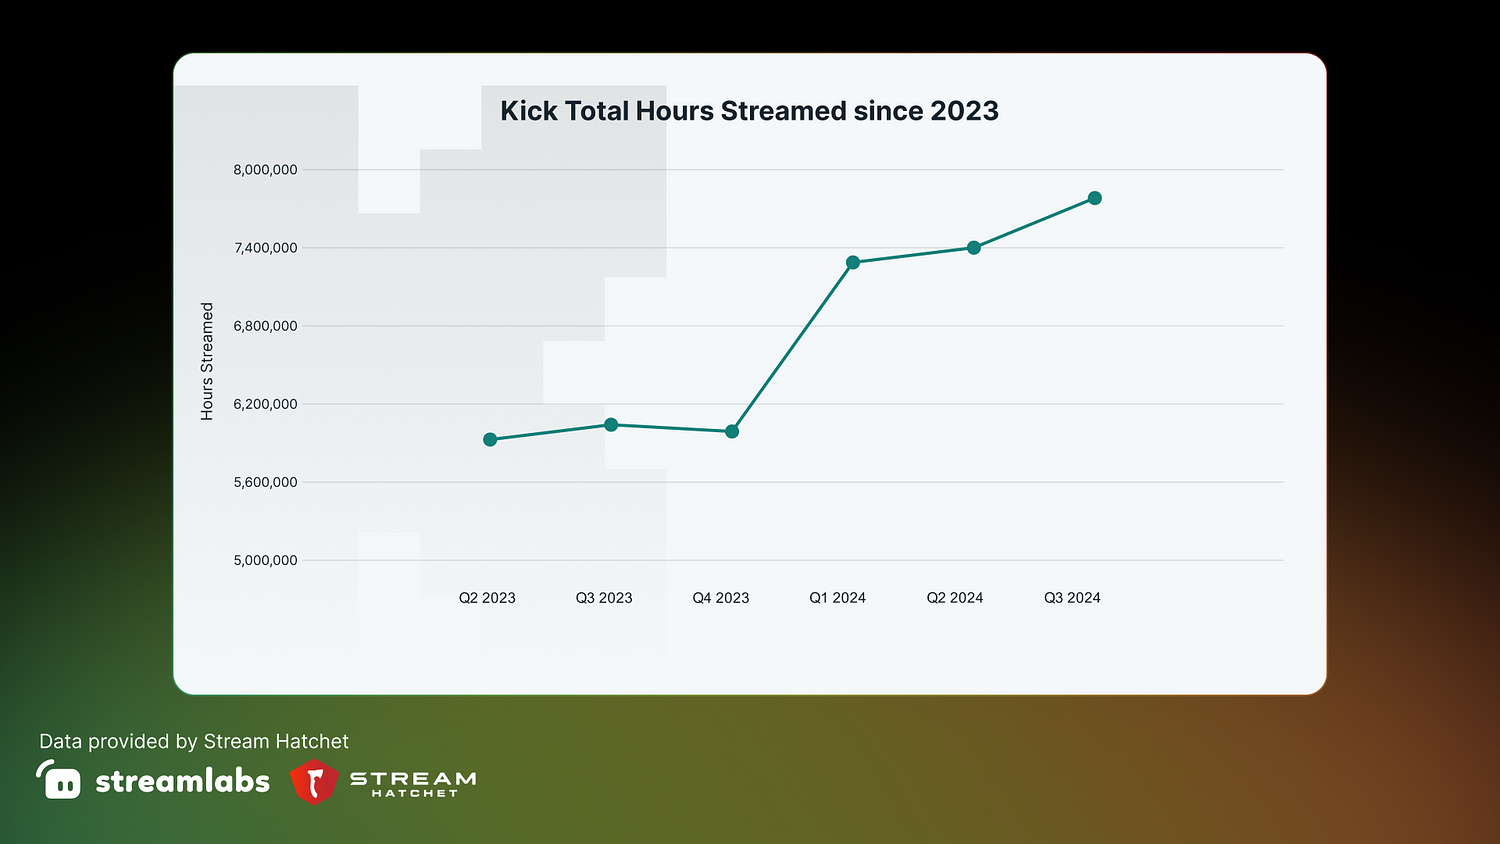
Analyzing the data for hours streamed on Kick from Q2 2023 to Q3 2024, we observe a growth trend similar to hours watched, albeit with more modest increases. Starting at 5,930,655 hours in Q2 2023, the number of streamed hours rose to 7,785,859 by Q3 2024, marking an overall growth of approximately 31%.
This increase indicates that content creators consistently adopt Kick as a viable platform. The correlation between hours watched and hours streamed suggests that Kick has managed to effectively scale both viewer and content creator engagement.
Unique Channels
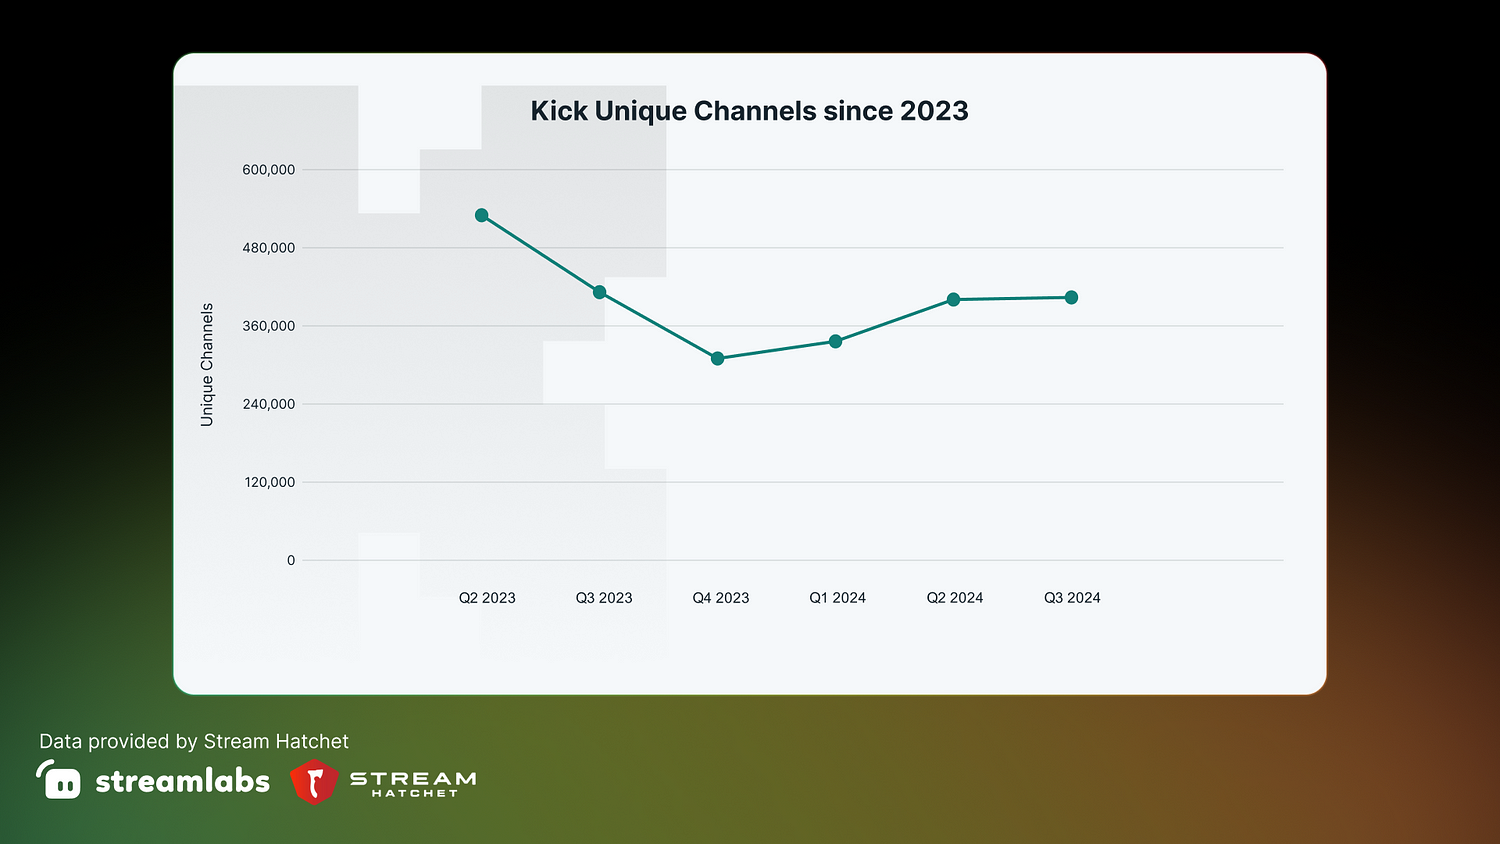
The trend in unique channels is more complex, with a noticeable drop from Q2 to Q4 2023, then a gradual rise. This dip might indicate an initial consolidation phase or increased competition among streamers before things stabilized and grew in the following quarters.
Platform Average Concurrent Viewership
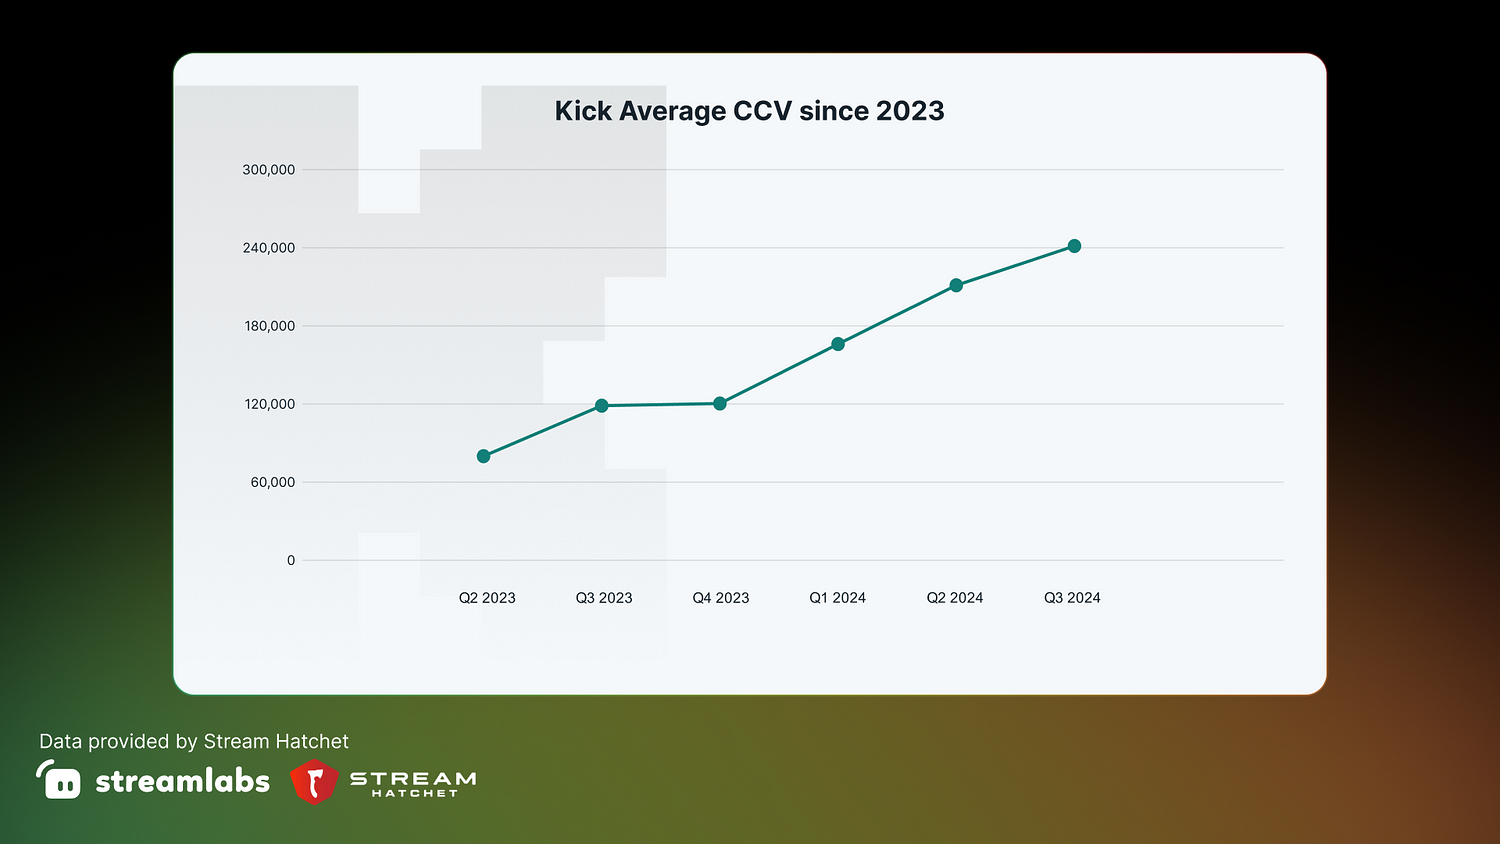
The platform’s average concurrent viewership data indicates a healthy upward trajectory for Kick from Q2 2023 to Q3 2024. Starting at 80,509 viewers, the platform consistently increased each quarter, reaching 241,806 concurrent viewers by Q3 2024. This represents an overall growth of approximately 200%, signifying a rapidly expanding audience base and improved user retention.
Twitch
Analyzing Twitch’s metrics shows a platform with ups and downs, adapting to global changes and rising competition. Thanks to increased digital activity during the pandemic, viewership, hours streamed, and unique channels hit a high but have since varied.
Despite a dip after the pandemic, Twitch has stabilized its audience with strong engagement and a large number of content creators. This resilience highlights its ability to attract and keep users, even with market saturation and new competitors like Kick. However, to keep growing and leading in the streaming industry, Twitch must stay innovative, focusing on better incentives for creators and more diverse content.
Ultimately, the data underscores Twitch’s role as a resilient streaming market leader while posing ongoing challenges as it navigates future industry shifts. Keep reading below for further insight.
Hours Watched
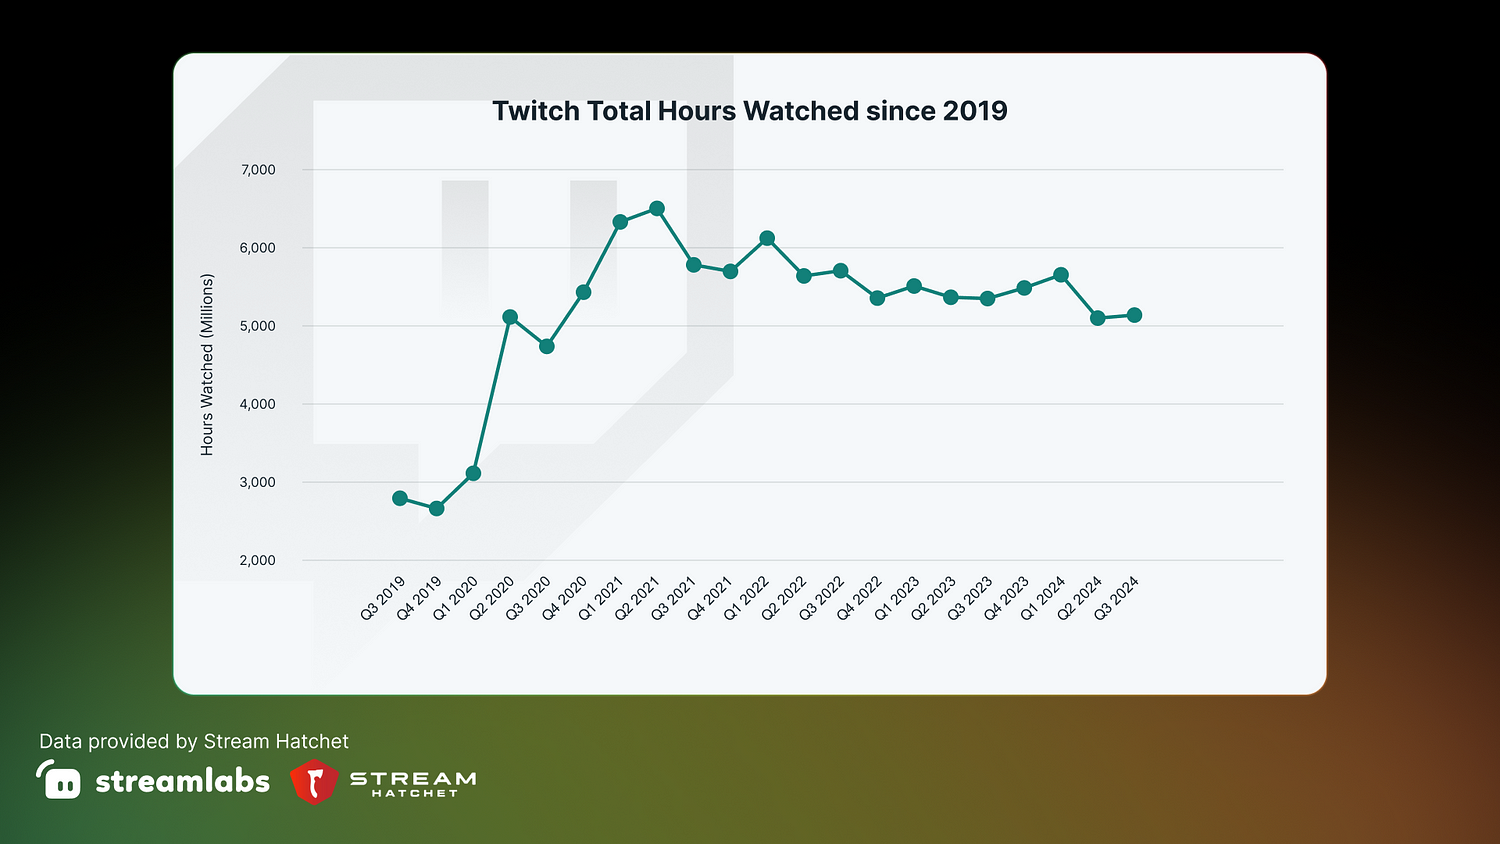
A closer look at the data above reveals a fluctuation pattern rather than consistent growth or decline.
The peak in viewership occurred in Q2 2021, with 6,510,520,171 hours watched due to the high online activity level during the global pandemic. Post-pandemic, there was a slight decline. However, the number of hours watched on Twitch appears to have stabilized, with no notable decrease or increase in hours watched in recent quarters.
While no absolute trends of sustained growth exist, the data suggests variable viewer engagement, which might be attributable to various factors, including content changes, seasonal trends, or platform competition. This information highlights the dynamic nature of the streaming industry and underscores the importance of platforms like Twitch continuously innovating to maintain and grow their viewer base.
Hours Streamed
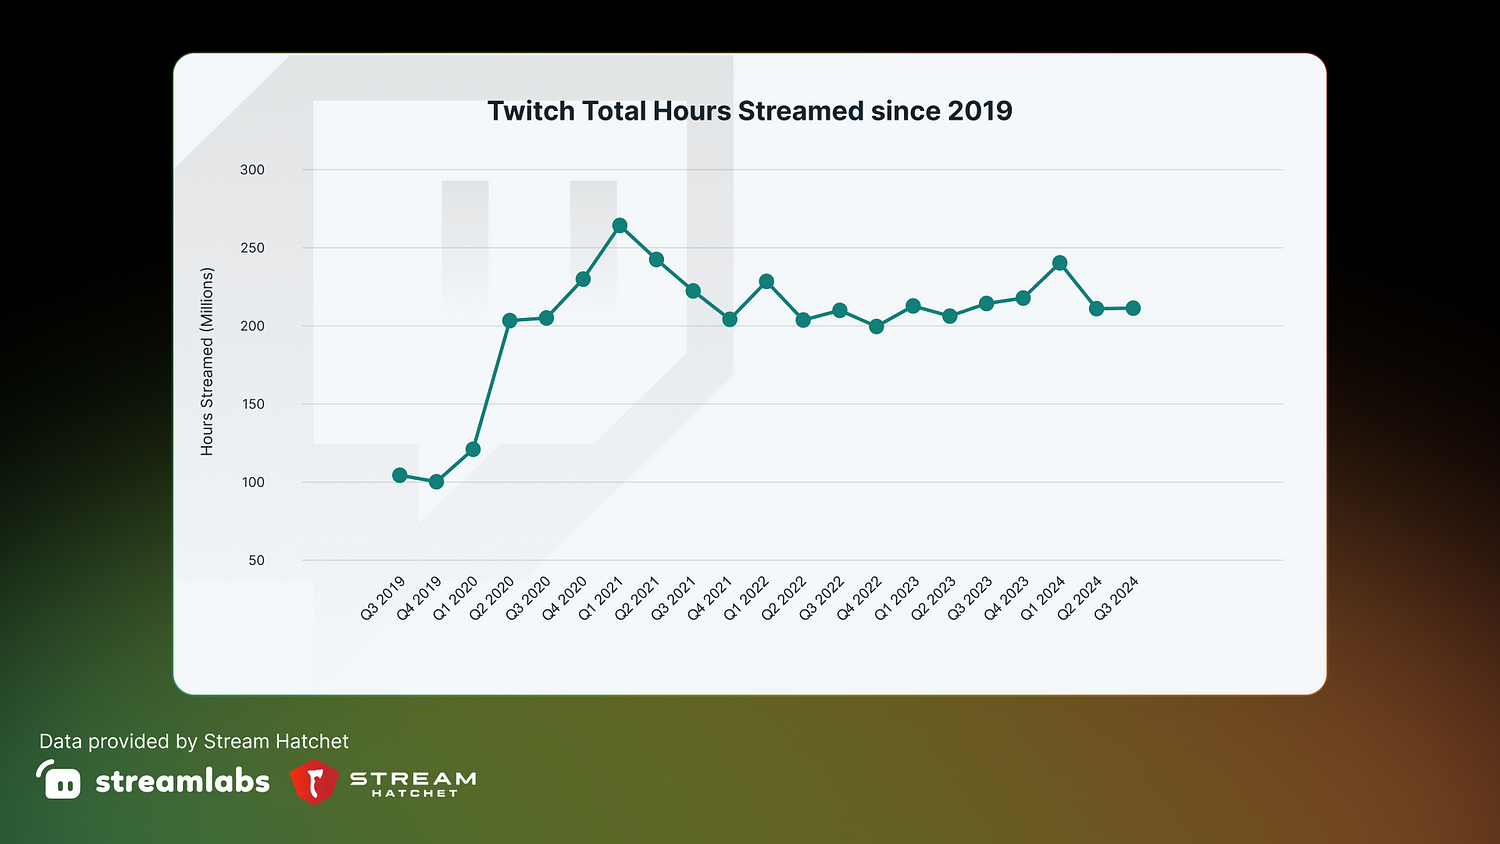
The hours streamed on Twitch from Q1 2021 to Q3 2024 exhibit a noticeable decline and fluctuation pattern. The data indicates that Q1 2021 recorded the highest number of streamed hours, with 264,859,226 hours. Post-pandemic, the data reflects a general decline and stabilization in streaming hours,
Throughout this period, the fluctuations in hours streamed could suggest an evolving platform dynamic possibly impacted by varying content trends, streamer engagement levels, and competition from rising platforms like Kick. For instance, after an initial decline from 2021, there appears to be a small resurgence around the end of 2021 into early 2022, indicating potential seasonal or trend-based spikes. The subsequent steady numbers suggest Twitch has found a new baseline for streaming activity, but it must innovate and engage creators to regain or stabilize growth further.
Unique Channels
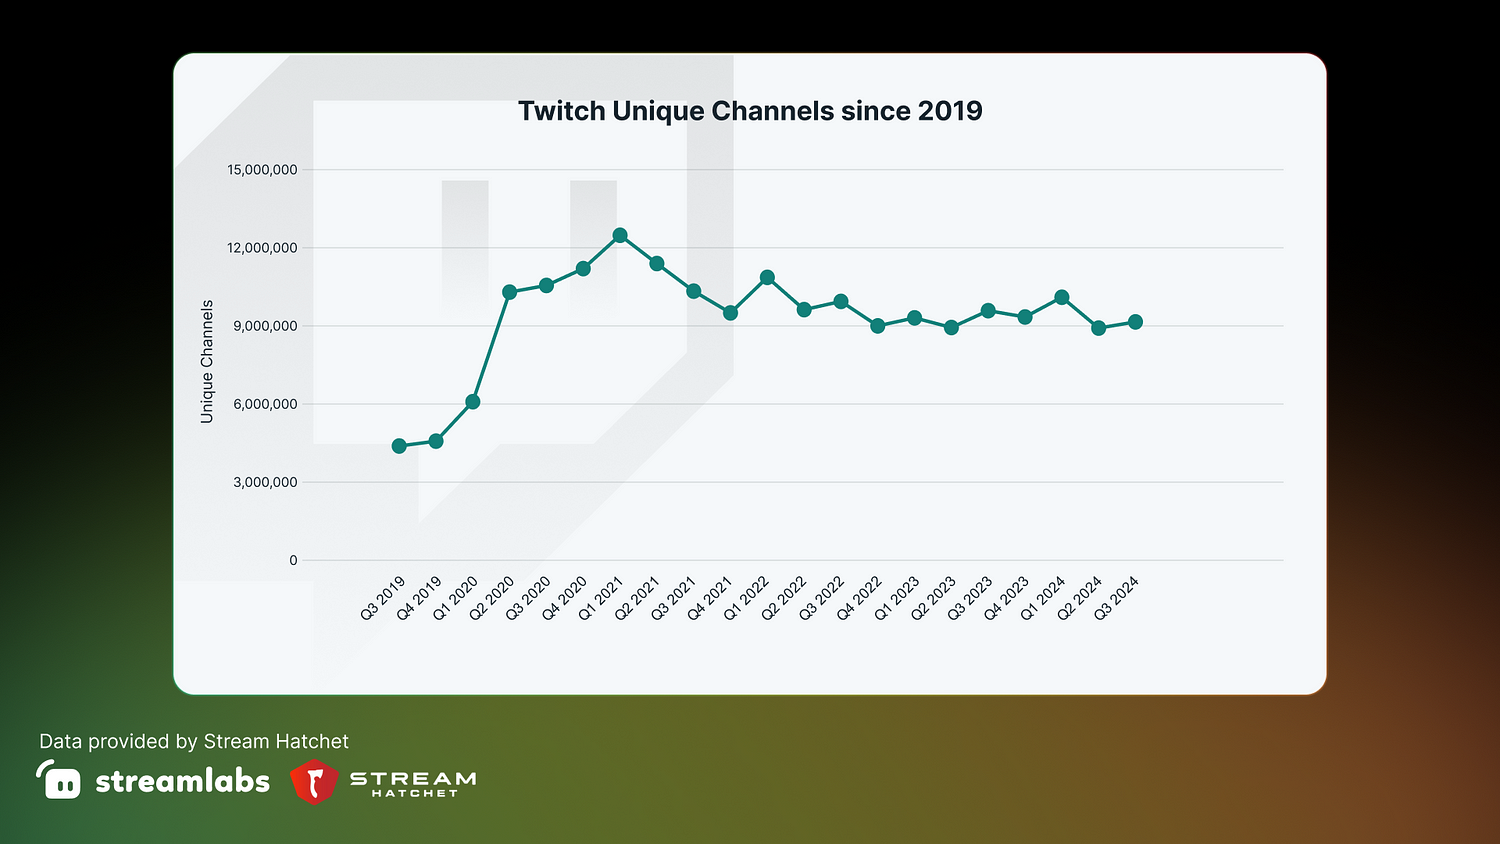
The unique channel data on Twitch reflects a dynamic fluctuation of content creators on the platform. Initially, there was significant growth, peaking in Q1 2021 with 12,499,486 unique channels, likely due to more people exploring streaming during the pandemic.
However, after the pandemic, the trend declined and fluctuated. Notably, there was a drop from Q1 2021 through Q4 2021, possibly indicating market saturation or changing priorities among creators as global conditions shifted. Despite these declines, there were periods of resurgence, like in Q1 2023, when unique channels rose to over 9 million, showing that Twitch still has a strong base for new and returning streamers.
This data suggests that while Twitch continues to attract many content creators, maintaining such a large pool is challenging due to ongoing competition and the evolving interests of the streaming community.
Average Concurrent Viewership
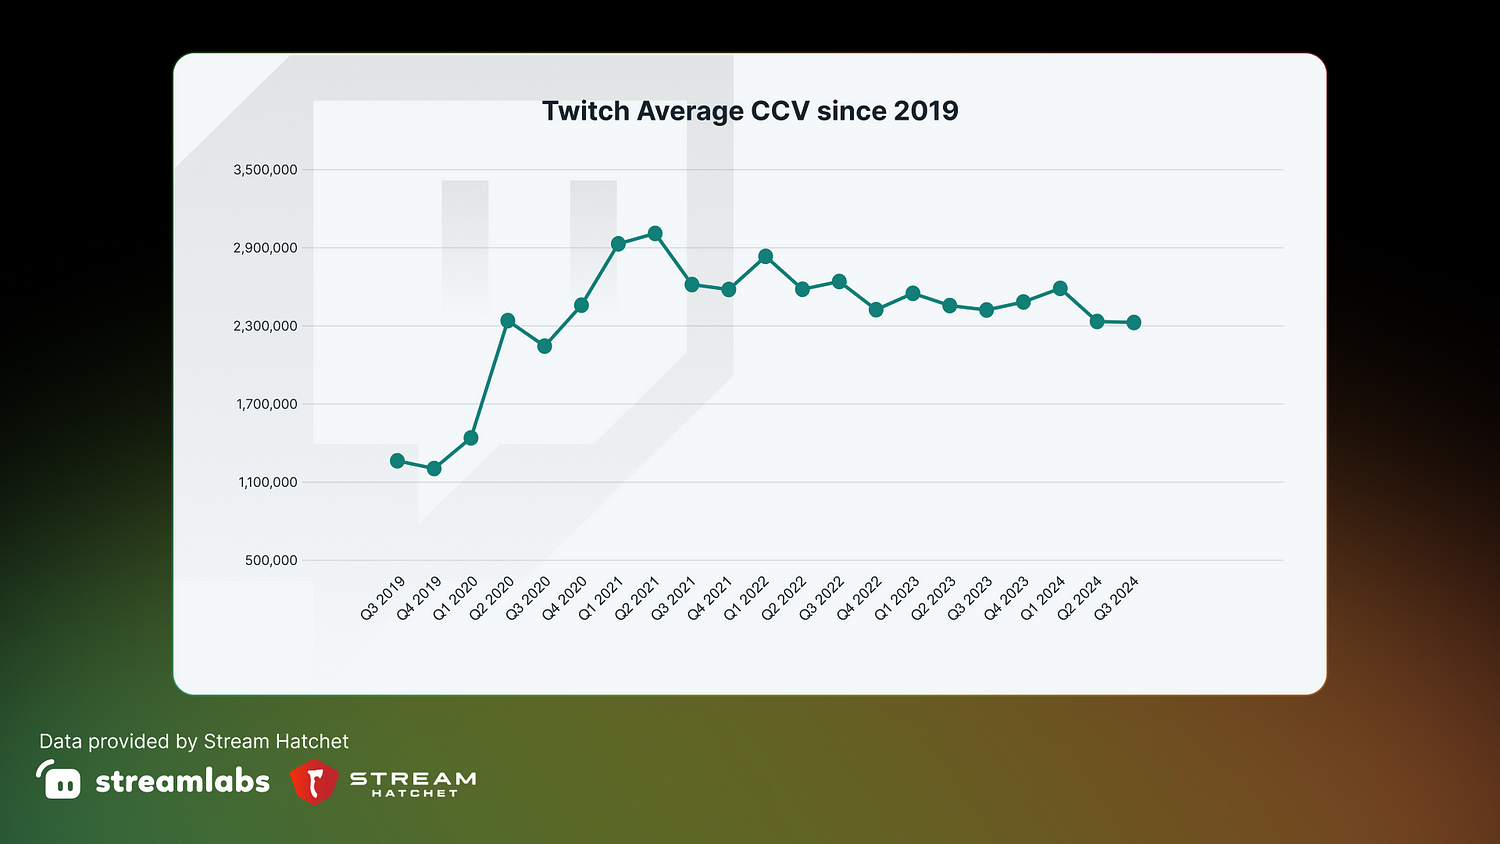
Twitch’s average concurrent viewership from Q1 2018 to Q3 2024 shows solid growth, followed by ups and downs. Viewership peaked in Q1 2021 with an average of 2,933,925 viewers, mainly due to increased activity during the pandemic.
However, there was a decline and fluctuation as things returned to normal, suggesting that viewer numbers stabilized as people returned to their pre-pandemic routines, which affected consistent growth.
Despite these shifts, Twitch has kept a large, steady audience, showing its resilience and the ongoing attraction of its content and community. Moving past the pandemic peak, while Twitch has maintained a significant viewer base, it faces challenges in reaching the same growth levels as before. The steady viewership suggests a loyal audience, even with competition from new platforms and changing content habits.
YouTube Gaming
Despite witnessing a decline in several metrics following the initial pandemic surge, YouTube Gaming has showcased a resilient comeback. Trends indicate a significant resurgence in hours streamed, unique channels, and average concurrent viewership. The increase in engagement and content creation in 2023 and 2024 suggests strategic advantages that YouTube Gaming has leveraged, such as its integration within the broader YouTube ecosystem and exclusive content offerings. This rebound reflects not only the platform’s ability to recover post-pandemic but also its growing prominence within the online streaming industry, highlighting the potential for continued innovation and audience retention in the competitive market space.
Hours Watched

The data on hours watched for YouTube Gaming from Q3 2019 to Q3 2024 reveals a dynamic landscape with notable trends. Starting at 724,280,585 hours in Q3 2019, there was a remarkable surge to 1,924,098,711 hours in Q4 2020. This spike can be attributed to the pandemic, similar to other streaming platforms, as more people turned to online entertainment during lockdowns.
Interestingly, there was a resurgence from Q1 2023 onwards, peaking in Q2 2024 at 2,201,835,406 hours.
While hours watched decreased in Q3 2024 compared to the previous quarter, YouTube Gaming experienced a year-over-year increase of 322,112,126 hours from Q3 2023 to Q3 2024, reflecting a growth rate of over 20%.
This growth trajectory contrasts with Twitch’s hours streamed data, which has experienced a decline since its pandemic peak in Q1 2021. YouTube Gaming’s increase in hours watched shows that the platform is successfully capturing audience interest and engagement over time, potentially through exclusive content and enhanced streaming capabilities.
In comparison, Twitch is struggling to maintain the same post-pandemic momentum. YouTube Gaming’s continued growth suggests effective strategies for engaging viewers, likely benefiting from its integration with the broader YouTube ecosystem, which could encourage more unique content and diverse creator engagement.
Hours Streamed
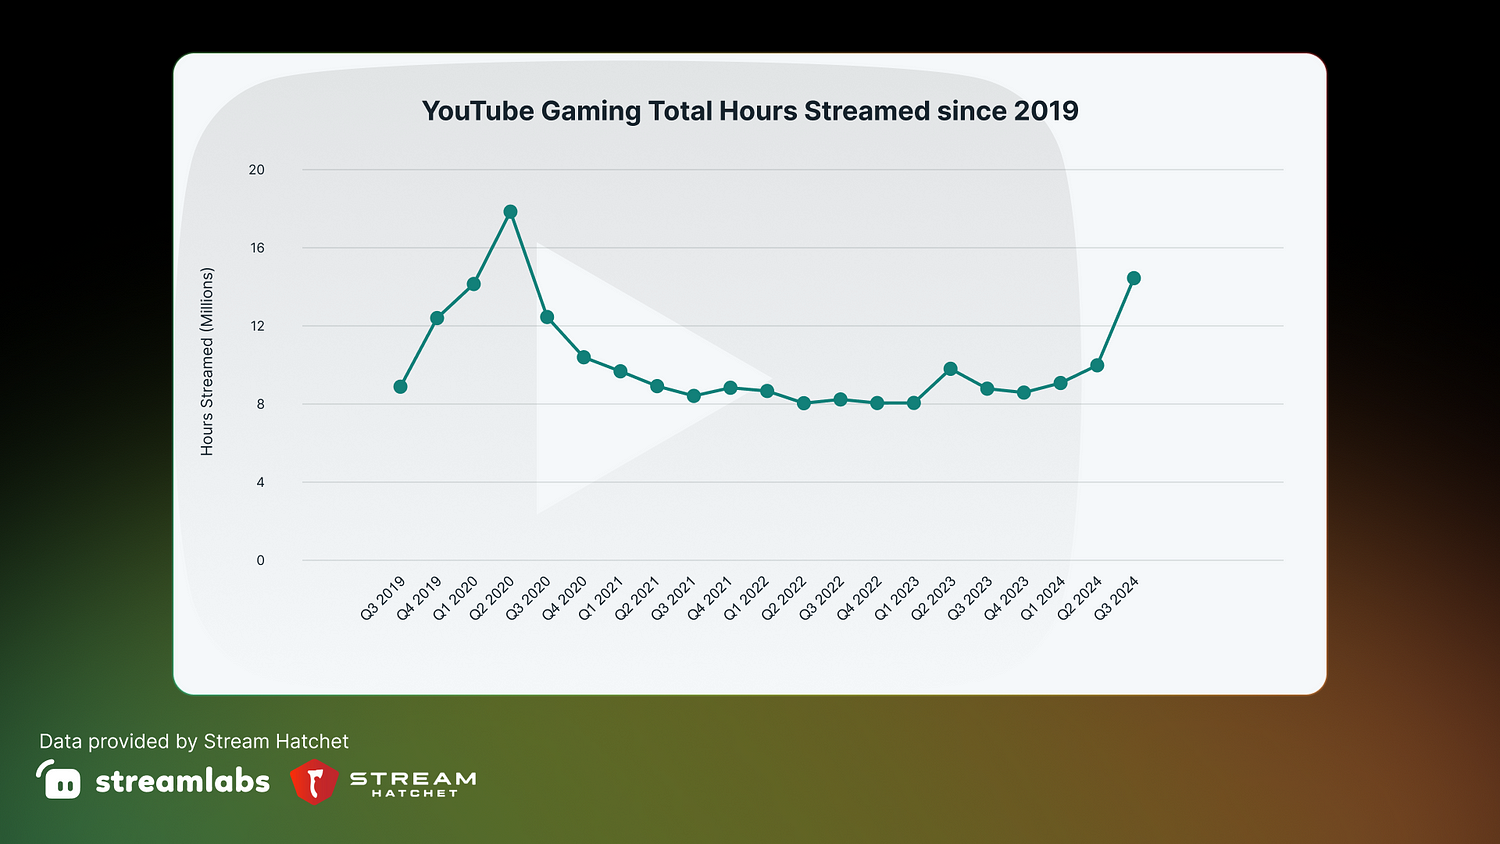
Hours streamed on YouTube Gaming peaked at 17,877,889 in Q2 2020, catalyzed by the pandemic-induced surge in online engagement. However, following this peak, a noticeable decline ensued, with streamed hours reaching a low of 3,889,213 in Q1 2023.
Despite this trough, the number of hours streamed recovered to 14,464,876 by Q3 2024.
Comparing quarter over quarter, the data represents a significant 44.79% increase in hours streamed from Q2 2024 to Q3 2024, indicating a substantial resurgence in content creation on the platform during this period.
The year-over-year percentage increase in hours streamed on YouTube Gaming from Q3 2023 to Q3 2024 is approximately 64.54%.
Unique Channels
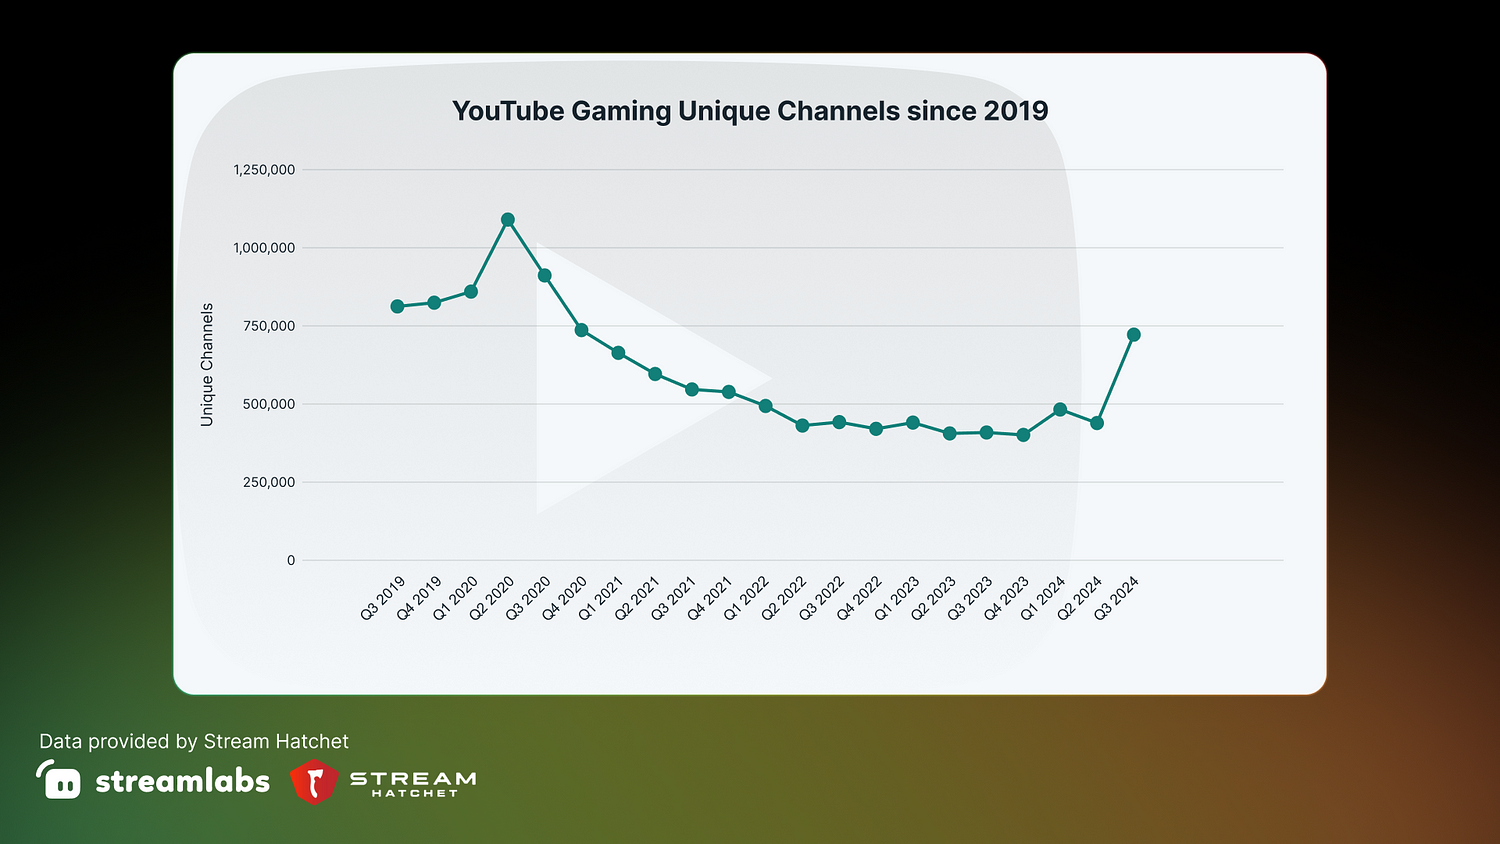
The data on unique channels for YouTube Gaming from Q3 2019 to Q3 2024 reflects significant fluctuations reflective of both the hours streamed and hours watched data.
Starting at 813,564 channels in Q3 2019, the number markedly increased to 1,092,063 by Q2 2020.
However, following this peak, the number of unique channels consistently decreased, hitting a low of 188,228 by Q1 2023. This decline could indicate challenges in sustaining content creation post-pandemic, possibly due to increased competition, platform policy changes, or creator burnout.
Interestingly, the post-Q1 2023 period shows a recovery trend, with the number of unique channels increasing to 723,096 by Q3 2024.
When analyzing the difference in unique channels for YouTube Gaming between Q3 2024 and the previous quarter (Q2 2024), there is a noticeable increase from 439,646 channels to 723,096 channels. This change represents a significant quarter-over-quarter percentage increase of approximately 64.48%.
Comparing Q3 2023 to Q3 2024, the number of unique channels jumps from 409,321 to 723,096. This represents a year-over-year percentage increase of approximately 76.64%. These figures indicate a robust resurgence in content creation within a year, suggesting renewed engagement and interest among creators on the platform.
Average Concurrent Viewership
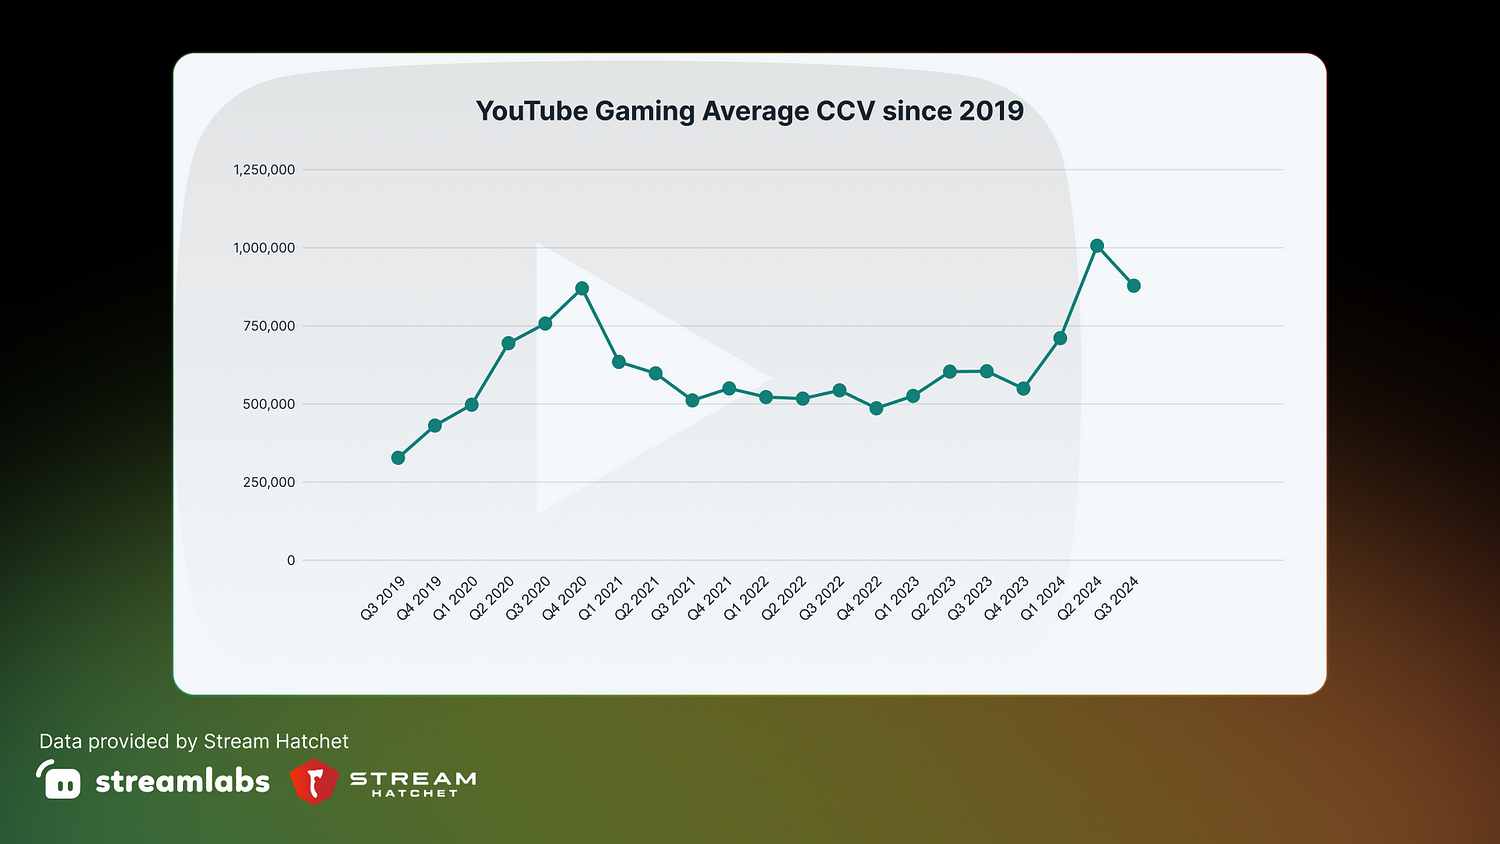
Average concurrent viewership on YouTube Gaming peaked at 871,422 by Q4 2020, in line with the pandemic’s impact on digital entertainment consumption. However, a subsequent decline followed, with the average viewership dropping to a low of 409,410 by Q1 2023.
Remarkably, viewership recovered significantly afterward, reaching 1,008,166 by Q2 2024 — a year-over-year increase from 605,578 in Q2 2023, amounting to approximately 66.39%.
Despite a slight decline to 879,868 in Q3 2024, the overall trend reflects a resilient and growing user base with increased engagement over the year.
Steam
Although known for its gaming marketplace, Steam also represents a large portion of the live game streaming ecosystem. As such, we’ve compiled data on hours watched, streams, unique channels, and average concurrent viewership from Q3 2019 to Q3 2024.
The overall analysis indicates that Steam has remained a steadfast pillar in the streaming ecosystem. The variation between hours watched, hours streamed, and unique channels suggest that while content creation has held stable, user engagement can vary significantly, highlighting the influence of content quality and how it aligns with consumer interest.
Hours Watched
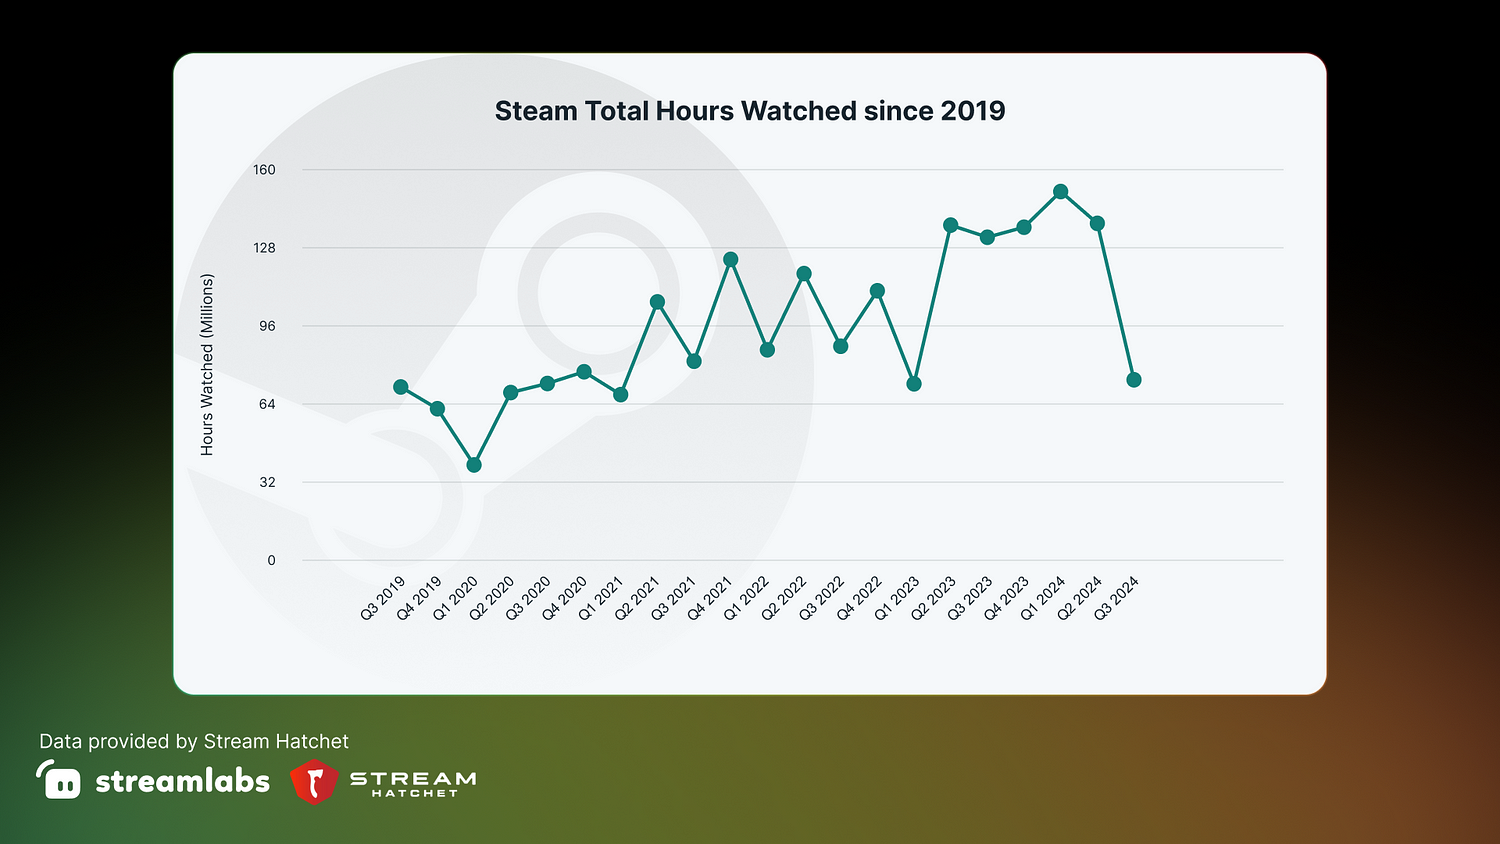
The hours watched on Steam from Q3 2019 to Q3 2024 show a dynamic pattern of peaks and troughs, indicative of fluctuating viewer engagement over the years.
Initially, the hours were relatively stable at 71,077,908 in Q3 2019, but they declined to 39,088,024 by Q1 2020. However, significant growth occurred in subsequent quarters, especially post-pandemic, with hours watched reaching notable highs, such as 123,423,927 in Q4 2021 and 137,478,824 in Q2 2023.
Although there was a decline in Q3 2024 compared to the previous quarters and some fluctuations, the hours consistently hovered above 100 million in several quarters, underscoring Steam’s robustness as a key player in the streaming ecosystem.
Hours Streamed
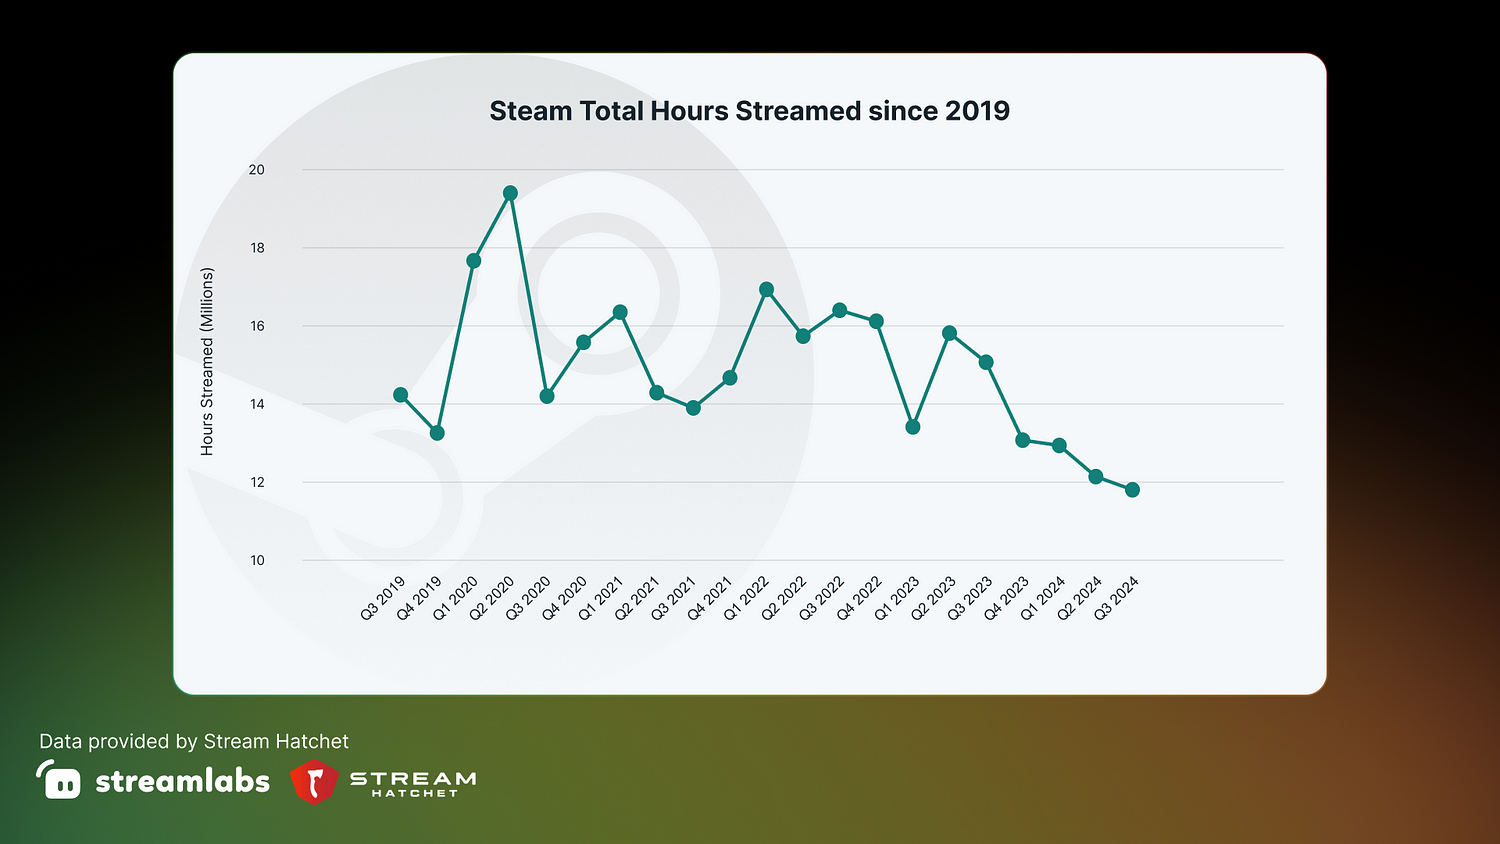
In terms of hours streamed, the numbers have shown more stability compared to hours watched. After a noticeable high of 19,406,562 in Q2 2020, prompted likely by the initial pandemic-driven surge in online activity, the hours streamed generally settled within a narrower range, remaining primarily between 12 to 17 million hours across various quarters. This stability could indicate that while viewership may fluctuate greatly depending on available content and other market factors, streamers themselves have maintained a relatively consistent output on Steam.
Unique Channels
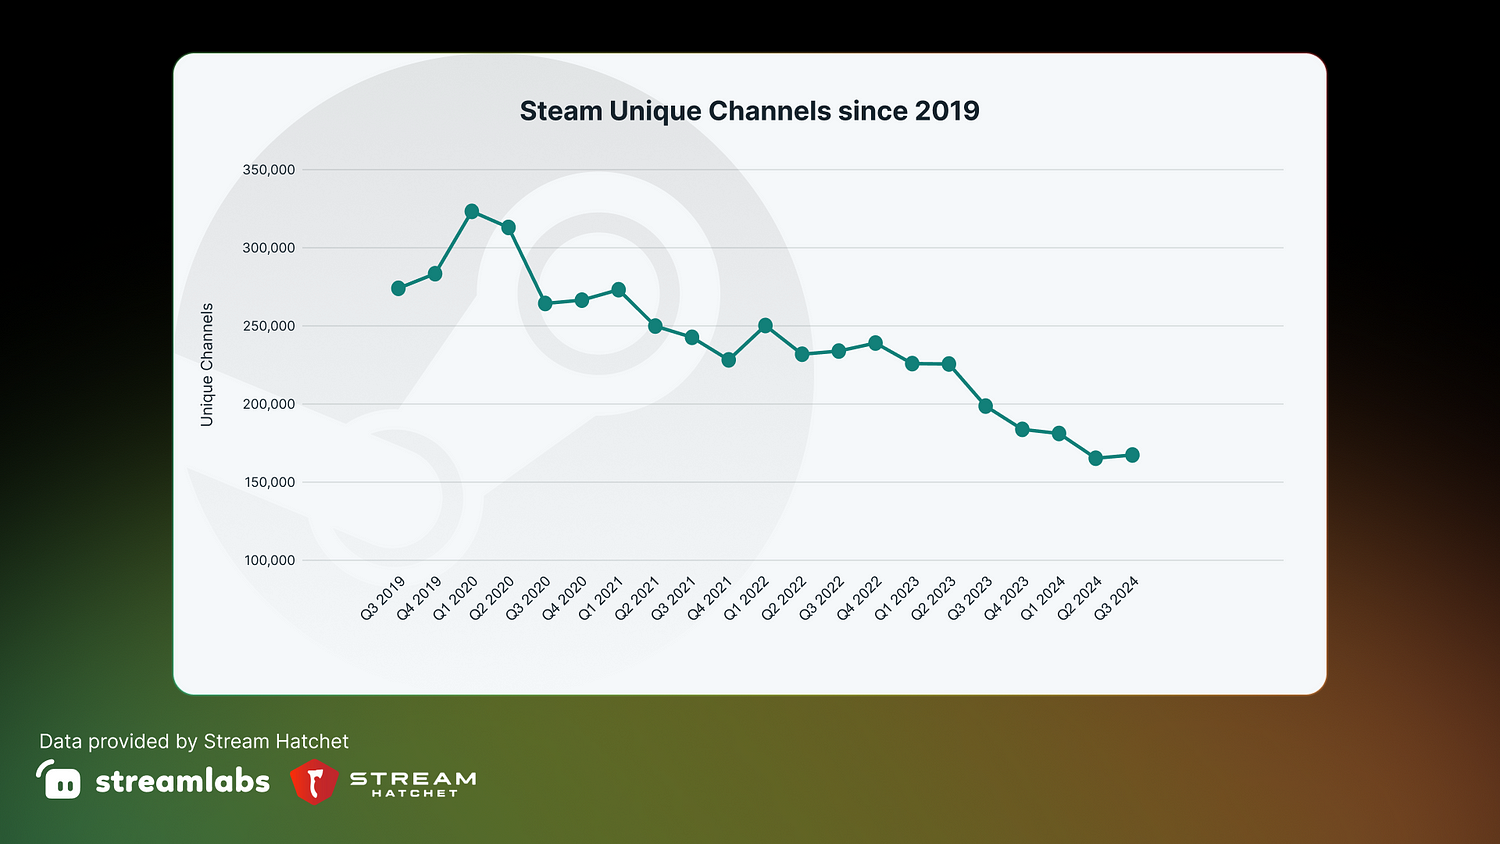
The number of unique channels shows a gradual decline, reaching its lowest at 165,326 in Q2 2024 before a slight recovery to 167,404 in Q3 2024. This trend might imply challenges faced by small or new creators in gaining visibility.
Comparing Q3 2024 to the same quarter in the previous year (Q3 2023), where the unique channels were 198,764, there is a noticeable decline to 167,404. This year-over-year shift equates to a decrease of approximately 15.78%, indicating ongoing challenges for creators in achieving growth on the platform.
While Steam has demonstrated an ability to attract substantial viewership during peak periods, the platform faces challenges in maintaining a high number of active channels. This decline highlights the challenges small creators face in sustaining growth on the platform. This might suggest a need for Steam to explore new strategies to support and promote a diverse array of streamers.
Average Concurrent Viewership
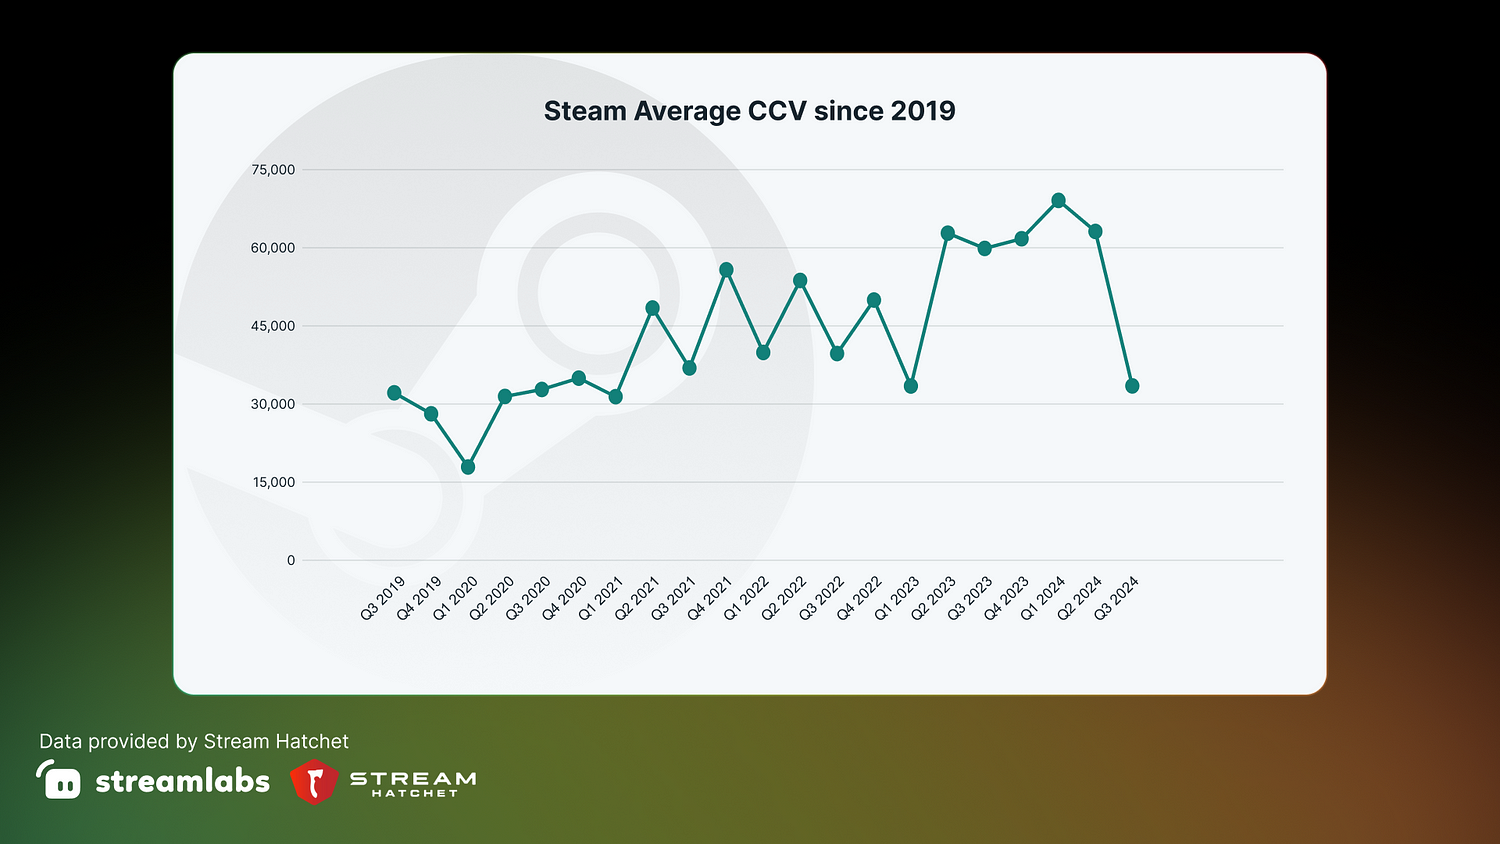
The average concurrent viewership shows fluctuation but ultimately demonstrates an upward trend in engagement. From 32,191 in Q3 2019 to 69,263 in Q1 2024, this growth signals an increased viewer presence on the platform over time, aligning with larger digital consumption trends.
Facebook Gaming
Since it started, Facebook Gaming has steadily expanded its market presence, significantly growing its streamer base and viewer engagement. Even with tough competition from big names like Twitch and YouTube Gaming, Facebook Gaming has found its niche by integrating with the broader Facebook ecosystem, making access easy and promotion seamless. However, since Q3 2020, the platform has seen a noticeable drop in all metrics, leading to speculation about how changing user interests could affect this platform's longevity.
Hours Watched
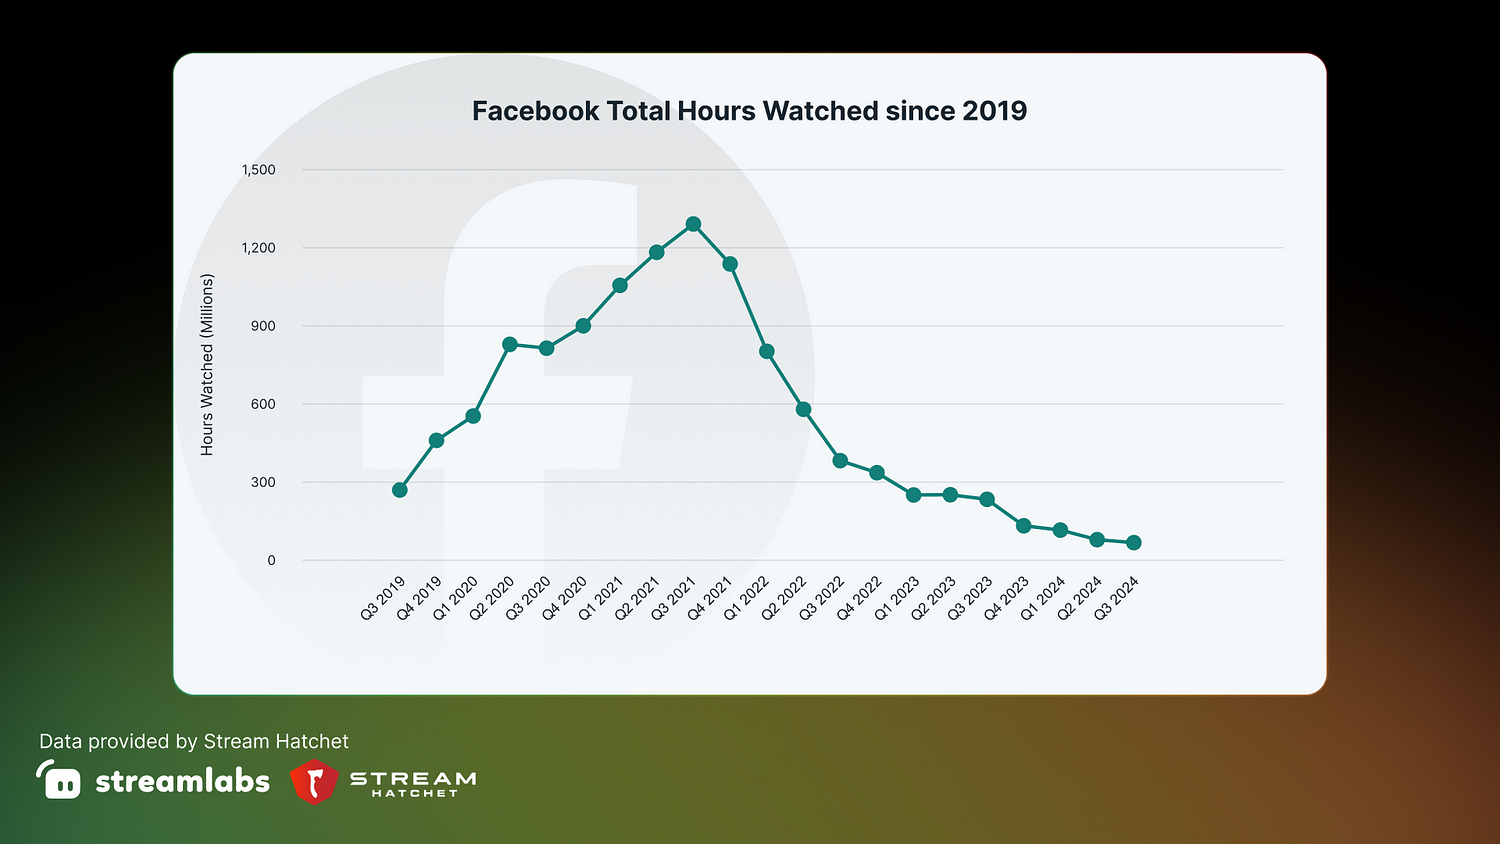
The data on Facebook Gaming indicates initial explosive growth followed by a gradual decline. At its peak during Q3 2021, the platform achieved over 1.29 billion hours watched. However, by Q3 2024, hours watched plummeted to 66 million, representing an approximately 94% decrease from the peak.
Analyzing the quarter-over-quarter change for Facebook Gaming from Q2 2024 to Q3 2024, hours watched decreased from 77,975,378 to 66,511,853. This represents a quarter-over-quarter percentage decrease of approximately 14.72%.
Comparing Q3 2024 to the same quarter in the previous year (Q3 2023), where the hours watched were 233,215,862, there is a significant decline to 66,511,853 hours. This year-over-year shift equates to a decrease of approximately 71.47%. Both metrics highlight a substantial drop in viewer engagement on the platform over the recent quarters and years.
Hours Streamed
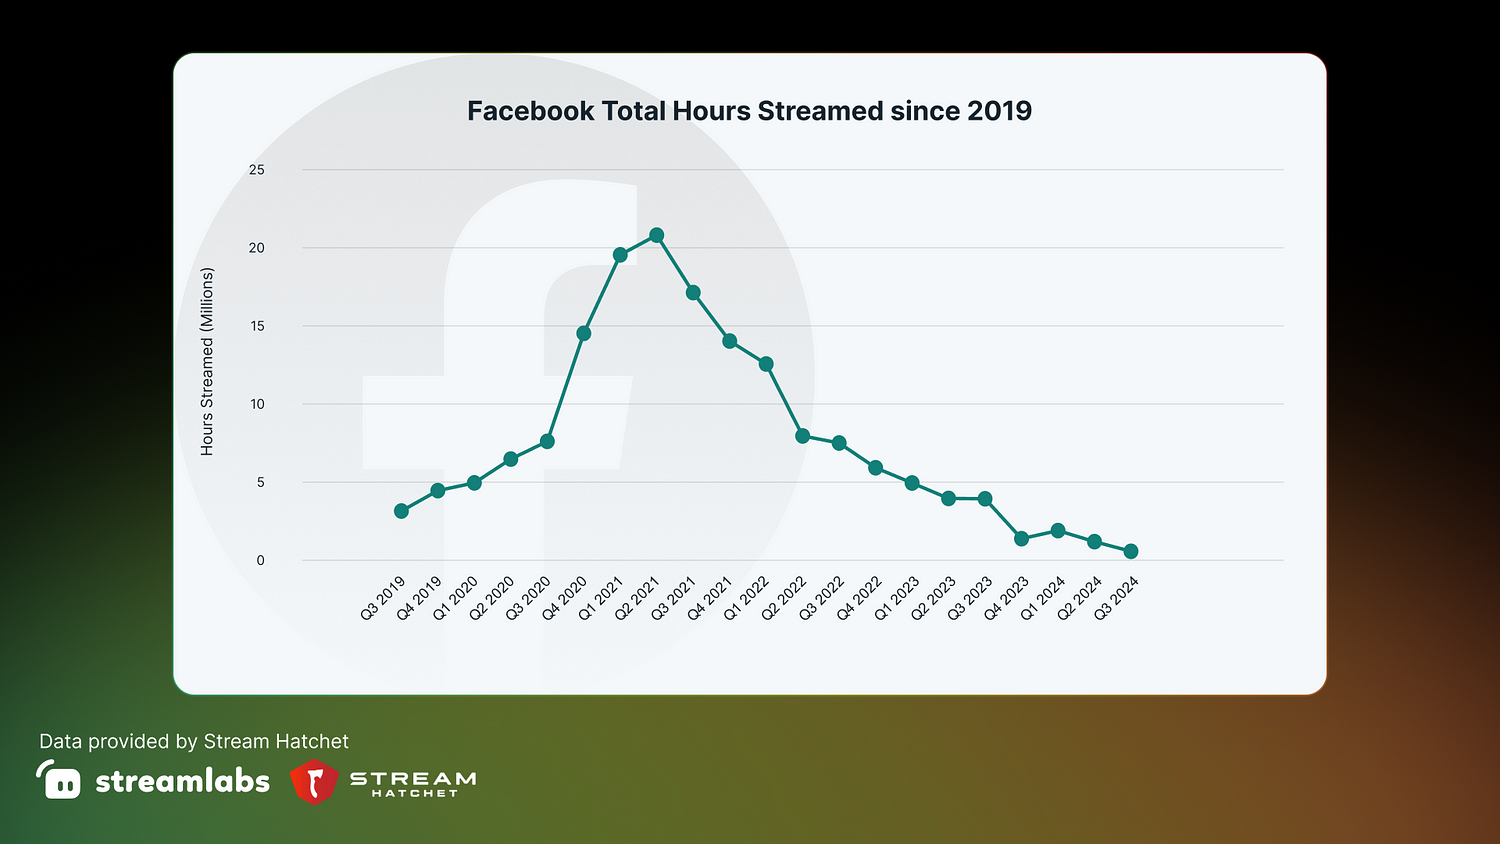
The hours streamed exhibit a similar trend to hours watched, with the highest number reaching over 20 million in Q2 2021 before dropping to just over half a million in Q3 2024. This decrease suggests a strong reduction in content creation on the platform.
Unique Channels

Similarly, unique channels saw a substantial rise to over 1.5 million in Q2 2021, followed by a steep decline to just 61,476 in Q3 2024, further implying creators’ migration away from the platform or challenges in maintaining content output.
Average Concurrent Viewership
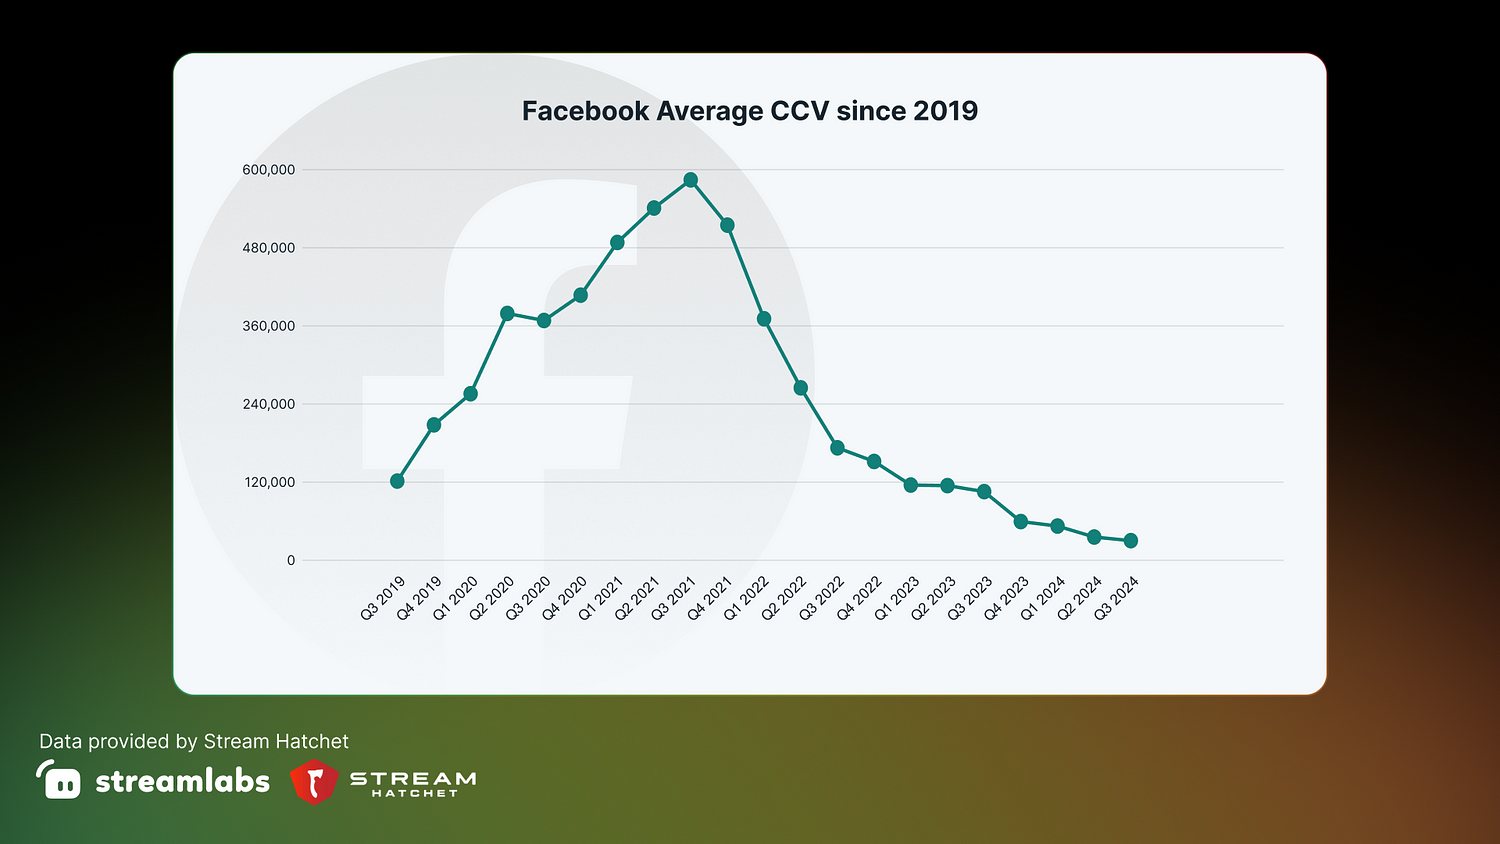
Average concurrent viewership also peaked significantly at over 585,000 in Q3 2021. However, it has since fallen to roughly 30,000 by Q3 2024, indicating reduced consumer interest or engagement on the platform.